Split Quality Analysis
A splitter's name tells you what kind of shift it is supposed to produce. The
SplitAnalyzer
tells you what shift it actually produced. Use it to validate that an "OOD"
split is genuinely more dissimilar than the random baseline — and to compare
splitters quantitatively.
SplitAnalyzer reports, for any train/test partition:
- Similarity metrics — the distribution of train↔test Tanimoto similarity.
- Scaffold metrics — scaffold overlap between train and test.
- Property distribution — divergence of physicochemical properties.
- Size metrics — basic partition-size sanity checks.
Basic usage
from alinemol.splitters import SplitAnalyzer, get_splitter

analyzer = SplitAnalyzer(smiles_list)

# Analyze a single split
splitter = get_splitter("scaffold")
train_idx, test_idx = next(splitter.split(smiles_list))
report = analyzer.analyze_split(train_idx, test_idx, splitter_name="scaffold")

print(f"Mean train-test similarity: {report.similarity_metrics.mean_sim:.3f}")
print(f"Scaffold overlap:           {report.scaffold_metrics.scaffold_overlap_percentage:.1f}%")
Comparing splitters
# One row per splitter, ready to sort or plot
comparison = analyzer.compare_splitters(["random", "scaffold", "kmeans"])
print(comparison)
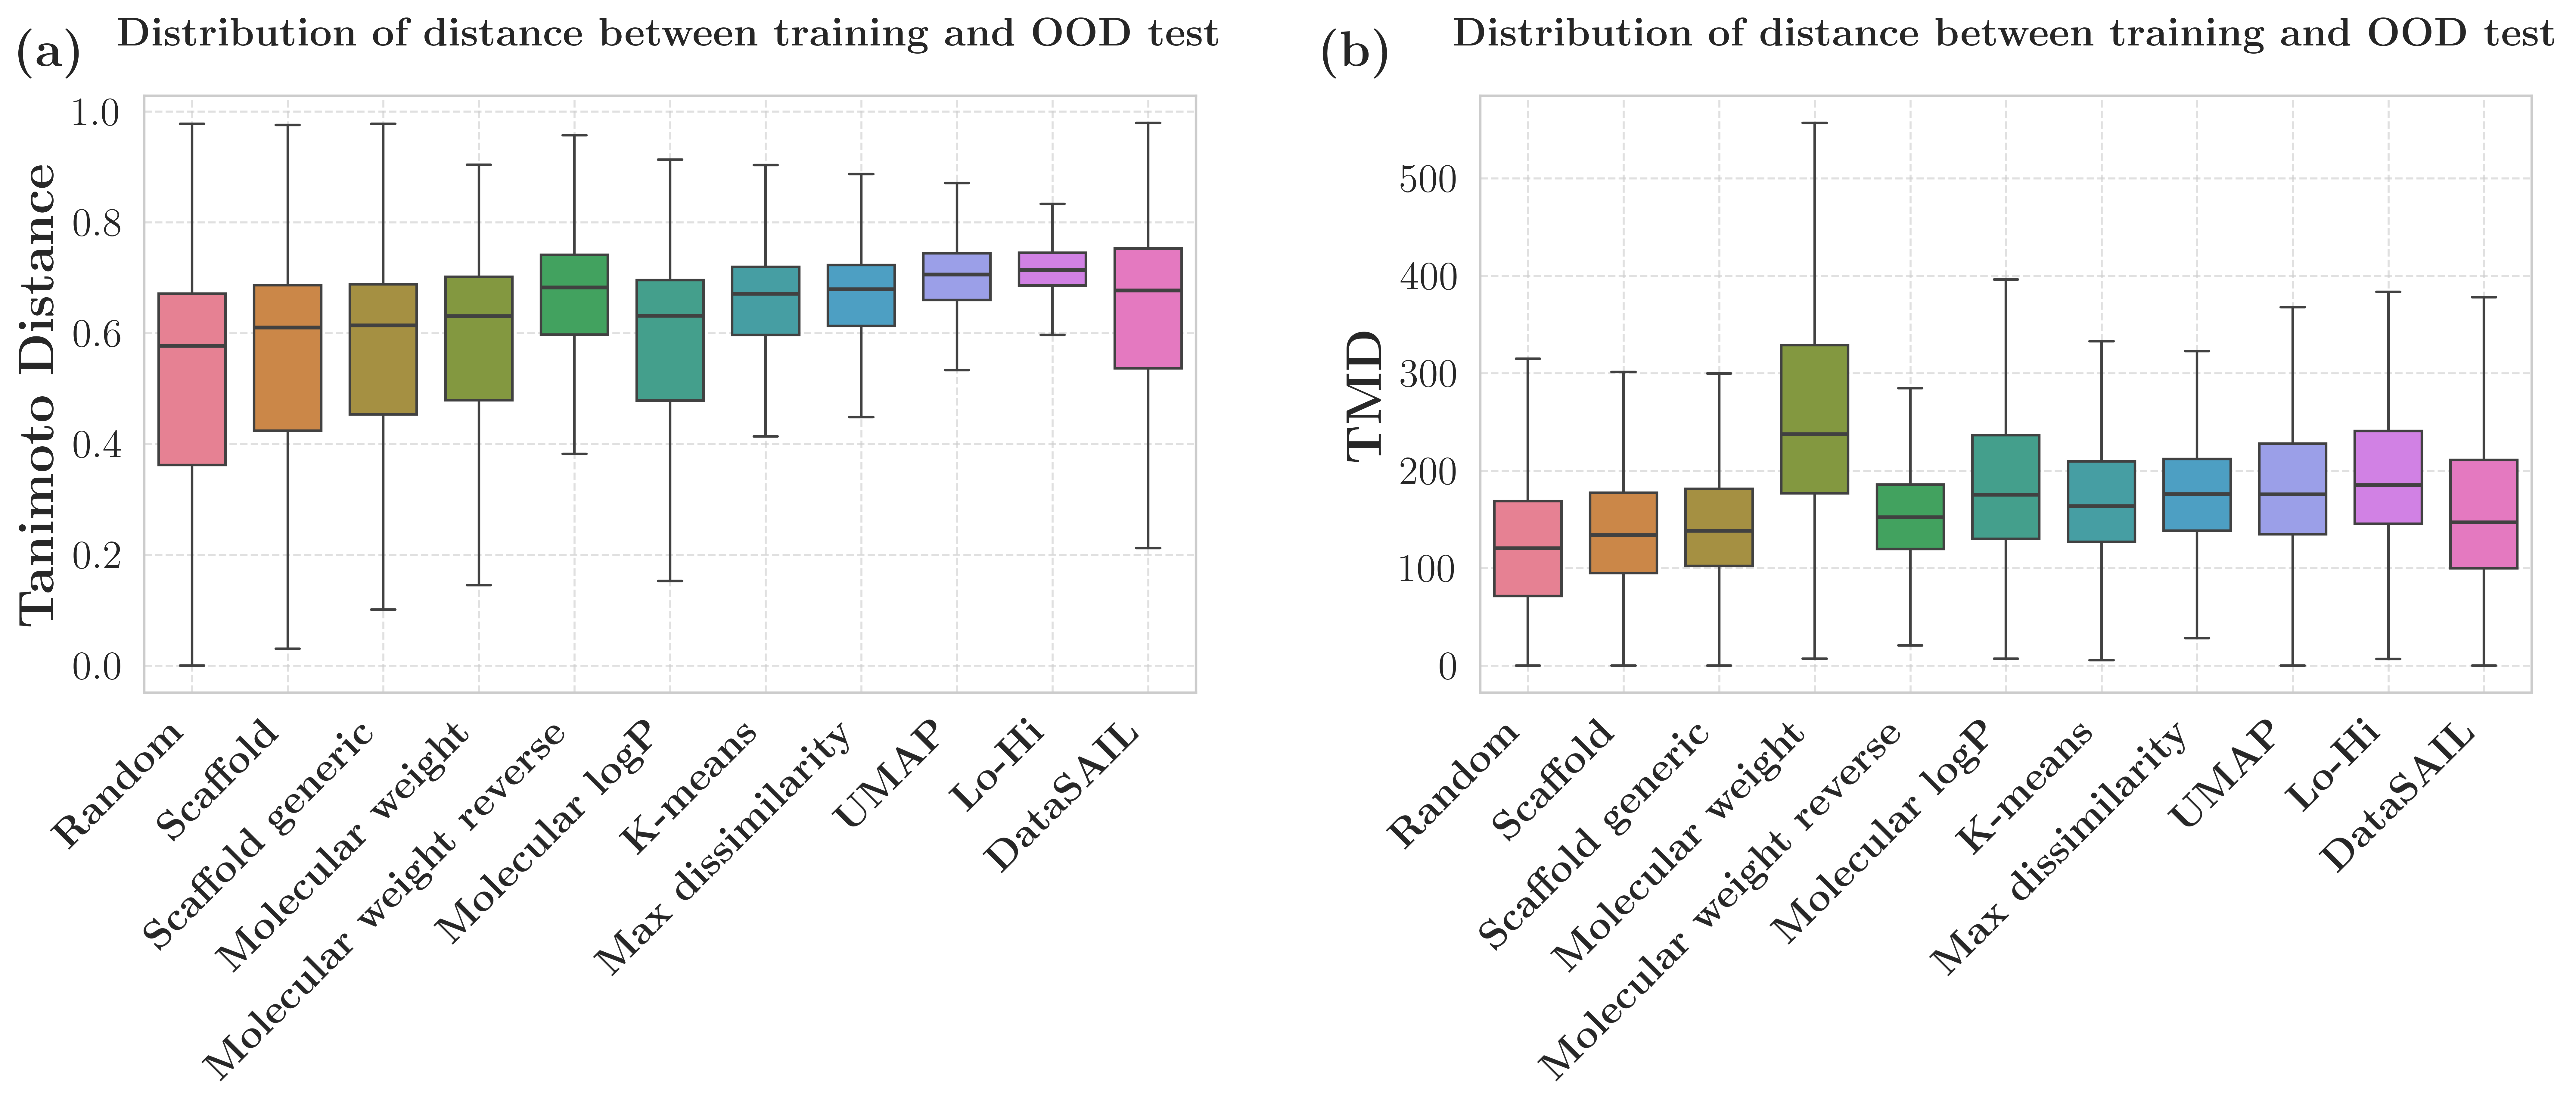
A well-behaved OOD splitter should show lower mean similarity and lower
scaffold overlap than random.
Reusing a precomputed Jaccard distance matrix
For studies that sweep many splitter × seed combinations on the same dataset,
recomputing pairwise Tanimoto similarity inside every analyze_split call is the
dominant cost. SplitAnalyzer can consume a precomputed pairwise Jaccard
distance matrix and slice into it instead:
import numpy as np
from alinemol.splitters import SplitAnalyzer

# Either pass a path to an .npy file (loaded with mmap)...
analyzer = SplitAnalyzer(
    smiles_list,
    precomputed_distance_matrix="datasets/TDC/CYP2C9/Jaccard_distance.npy",
)

# ...or pass the array directly.
distance = np.load("datasets/TDC/CYP2C9/Jaccard_distance.npy")
analyzer = SplitAnalyzer(smiles_list, precomputed_distance_matrix=distance)
SMILES order must match the matrix
The matrix rows/columns are indexed by the same integer positions as the
SMILES list passed to SplitAnalyzer. Use
datasets/TDC/<NAME>/valid_canonical_smiles.txt (the SMILES list the matrix
was built from) in the same order. The CLI helper
scripts/analyze_splits.py:resolve_precomputed_distance auto-detects and
validates this alignment.
The precomputed Jaccard_distance.npy files shipped with each TDC dataset use
Morgan radius=2, 2048-bit fingerprints — the default SplitAnalyzer fingerprint
configuration. (Splitter clustering, by contrast, uses 1024-bit ECFP to
preserve the cluster boundaries of the published splits.)
Command-line analysis
# Analyze and compare splitters for a dataset from the terminal
python scripts/analyze_splits.py --help
See the Splitters API for the full SplitAnalyzer
signature and the dataclasses it returns (SplitQualityReport,
SimilarityMetrics, ScaffoldMetrics, PropertyDistribution, SizeMetrics).