Out-of-Distribution Evaluation
Machine learning models for molecular property prediction are usually validated on a random split of the available data. This measures in-distribution (ID) performance — how well the model does on molecules drawn from the same distribution it was trained on. But models are deployed on new chemistry: scaffolds, size ranges, and regions of chemical space that were absent (or rare) at training time. That is the out-of-distribution (OOD) regime, and it is where generalization actually matters for drug discovery.
ALineMol is built to measure the gap between ID and OOD performance in a rigorous and reproducible way.
What "out-of-distribution" means for molecules
Unlike images or text, molecules do not have a single obvious notion of distribution shift. ALineMol operationalizes several complementary notions, each realized by a family of splitters:
- Structural shift — the test set contains scaffolds or substructures unseen
in training (
scaffold,butina). - Property shift — the test set differs systematically in a physicochemical
property such as molecular weight or lipophilicity (
molecular_weight,molecular_logp). - Chemical-space shift — training and test sets occupy different clusters of
a fingerprint/embedding space (
kmeans,umap,max_dissimilarity,perimeter). - Similarity-controlled shift — the maximum train↔test similarity is bounded,
as in lead-optimization scenarios (
hi,lo).
The random splitter provides the ID reference point against which every OOD
splitter is compared.
The evaluation workflow
flowchart LR
    A[SMILES + labels] --> B[Choose splitter]
    B --> C[Generate ID split<br/>random]
    B --> D[Generate OOD split<br/>scaffold / kmeans / ...]
    C --> E[Train model]
    D --> E
    E --> F[Evaluate ID vs OOD<br/>ROC-AUC, accuracy]
    F --> G[SplitAnalyzer:<br/>quantify the shift]
G --> H[ID vs OOD relationship]- Split the dataset with both a random (ID) splitter and one or more OOD splitters.
- Train the same model on each training partition — classical ML
(
CML) or a GNN (FragGNN). - Evaluate on the corresponding test partitions with metrics from
alinemol.utils(eval_roc_auc,eval_acc, …). - Quantify the actual shift each split produced with
SplitAnalyzer, so the OOD label is validated, not assumed. - Relate ID to OOD performance across models, datasets, and splitters — the accuracy-on-the-line and agreement-on-the-line analysis described in Agreement-on-the-Line.
Reading the results
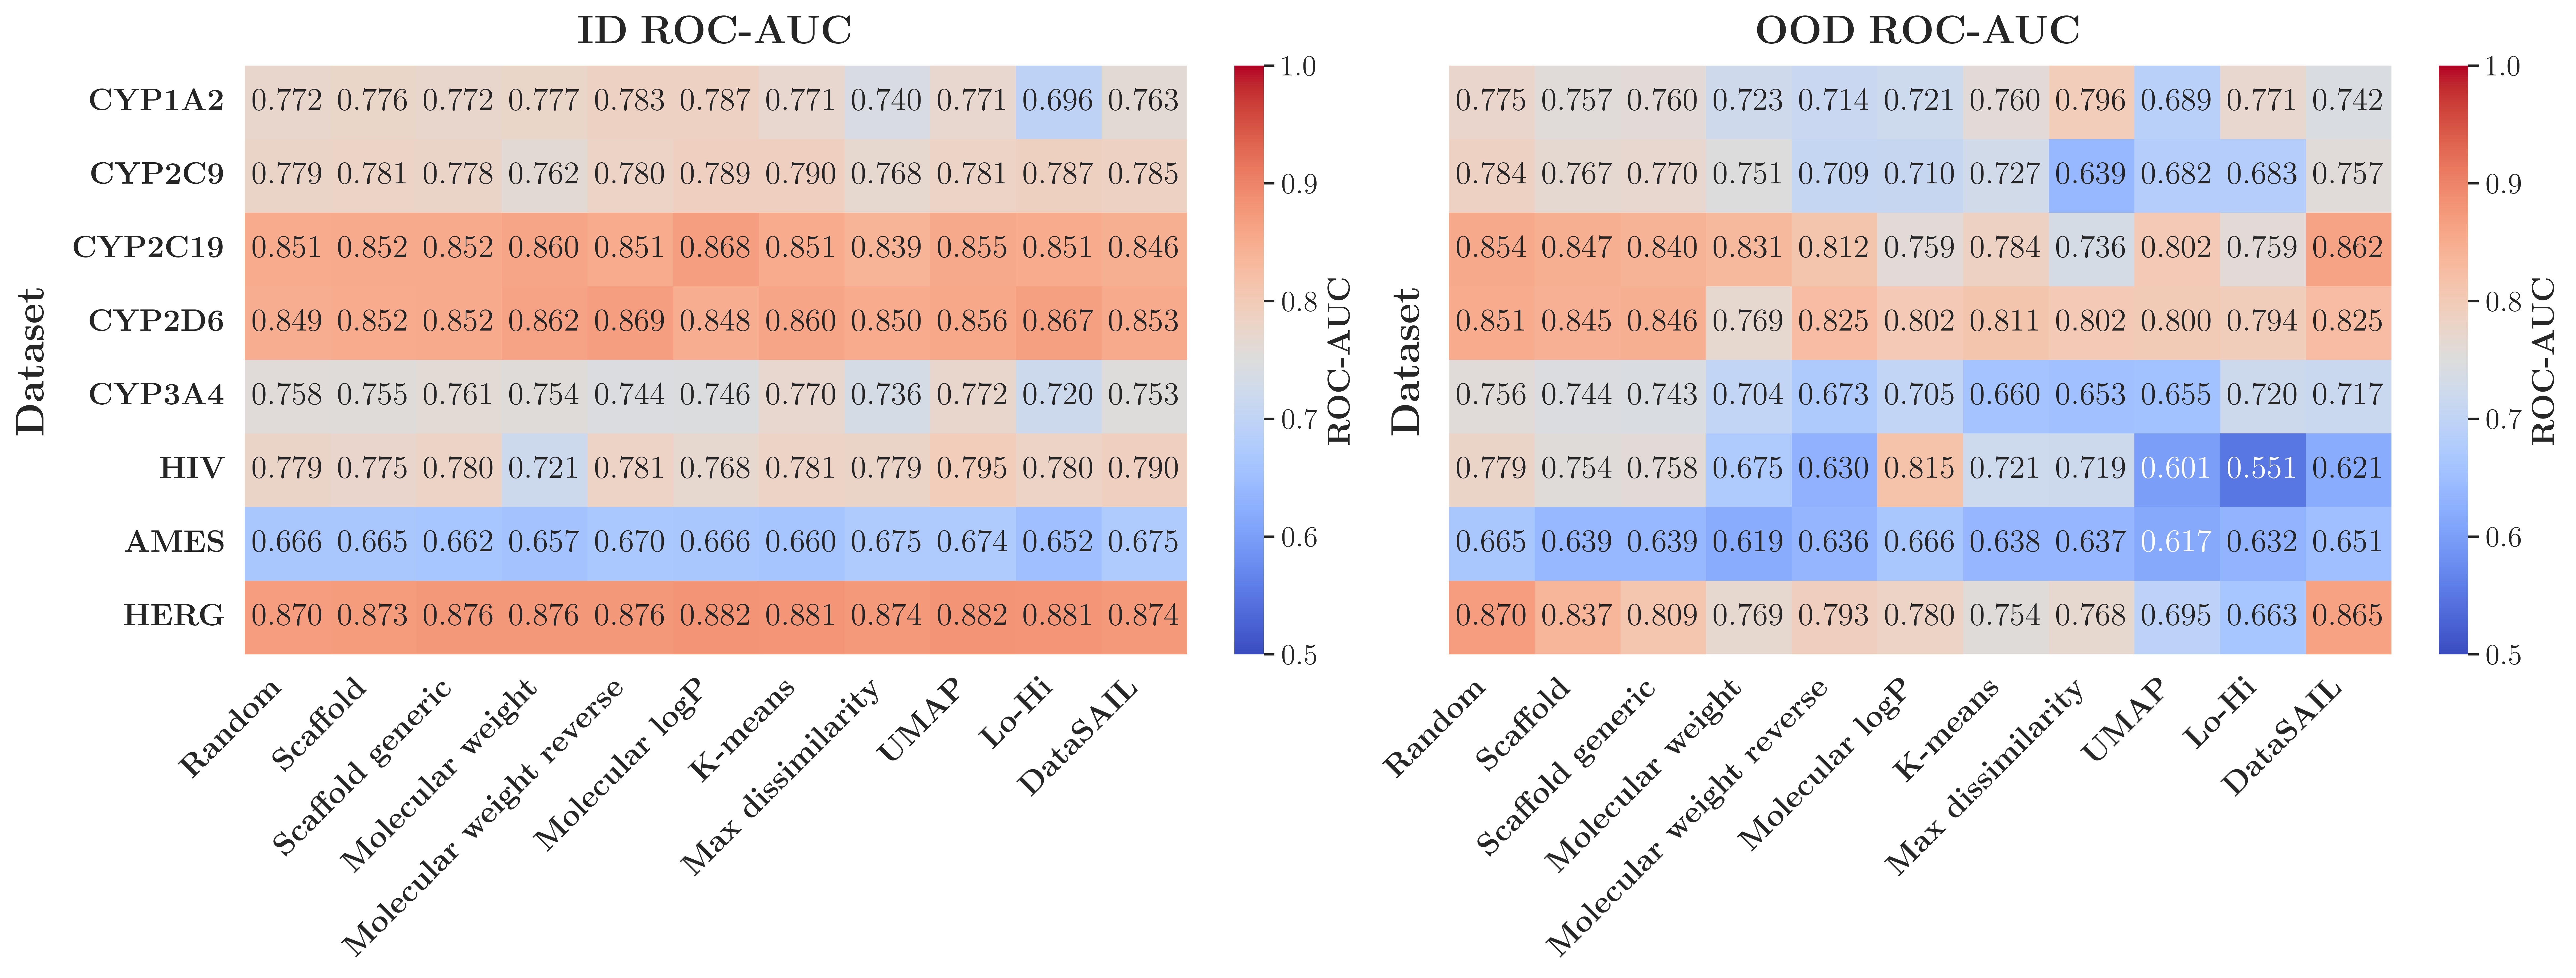
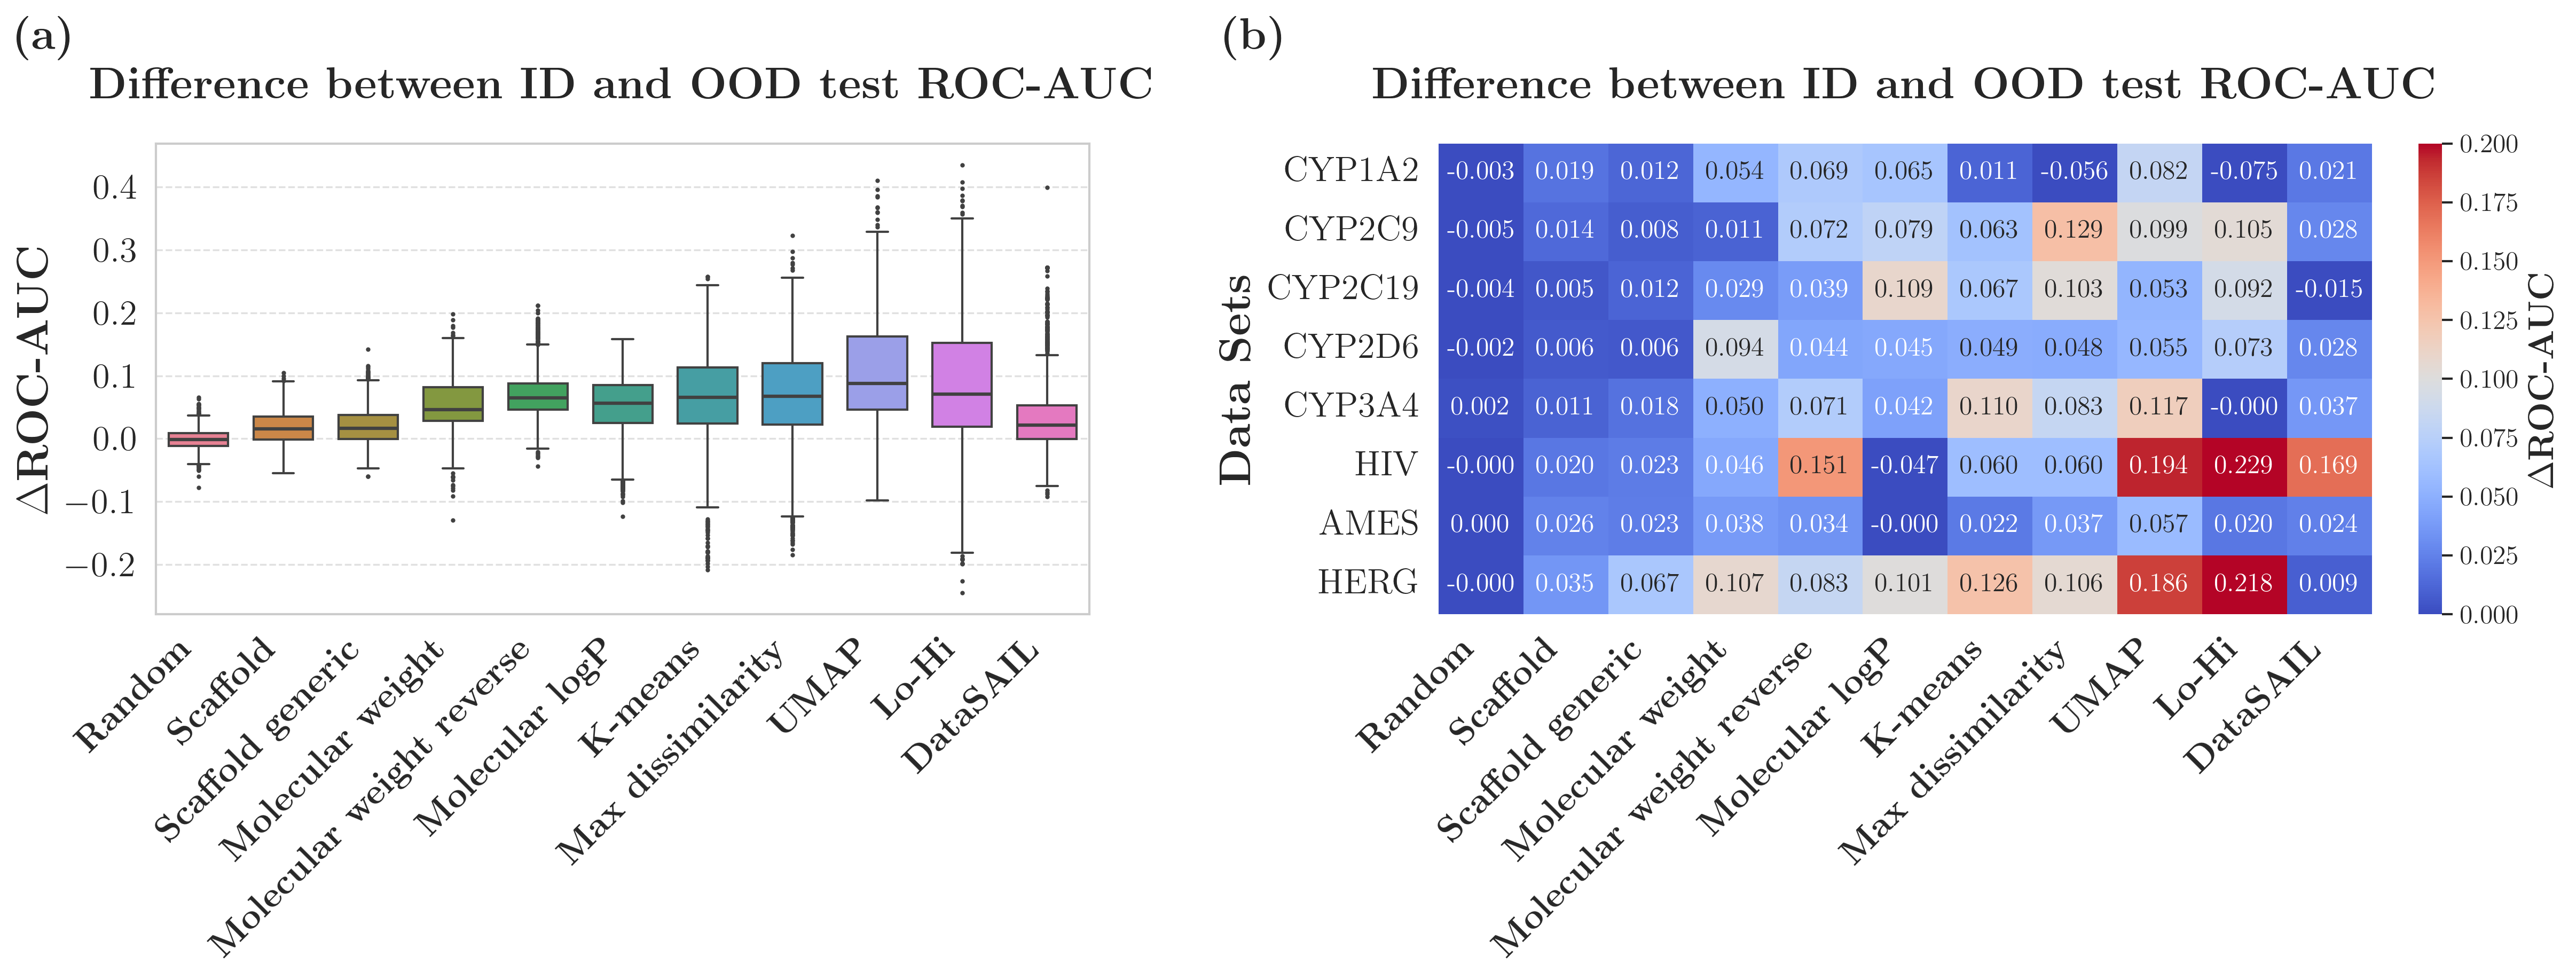
Systematic ID vs OOD comparison across datasets typically reveals a consistent generalization gap — OOD ROC-AUC sits below ID ROC-AUC, with the size of the gap depending on the splitter and the model family.
Next steps
- Splitting Strategies — pick the shift you want to test.
- Split Quality Analysis — prove your split is OOD.
- Agreement-on-the-Line — the ID↔OOD relationship at the heart of the paper.