Agreement-on-the-Line & Accuracy-on-the-Line
ALineMol takes its name from two closely related empirical phenomena studied in the robustness literature, applied here to the molecular domain:
- Accuracy-on-the-line — across many models, in-distribution (ID) accuracy is strongly, often linearly correlated with out-of-distribution (OOD) accuracy. When it holds, a model's ID performance is a usable predictor of its OOD performance.
- Agreement-on-the-line — the agreement between pairs of models on ID data is linearly correlated with their agreement on OOD data. This is powerful because agreement needs no labels, so it can be measured on unlabeled OOD molecules to estimate OOD accuracy.
The central research question ALineMol was built to answer:
Do accuracy-on-the-line and agreement-on-the-line hold for molecular property and activity prediction — and if so, when do they break?
Why it matters for drug discovery
If these relationships hold for molecules, you can estimate OOD performance without OOD labels — a major practical win, since labeling novel chemistry is exactly what is expensive and slow. If they break for certain shifts or model families, that itself is important: it tells you when ID validation is misleading and OOD performance must be measured directly.
How ALineMol tests it
- Train a diverse pool of models (classical ML + GNNs) on each dataset.
- Generate ID and OOD partitions with the splitters.
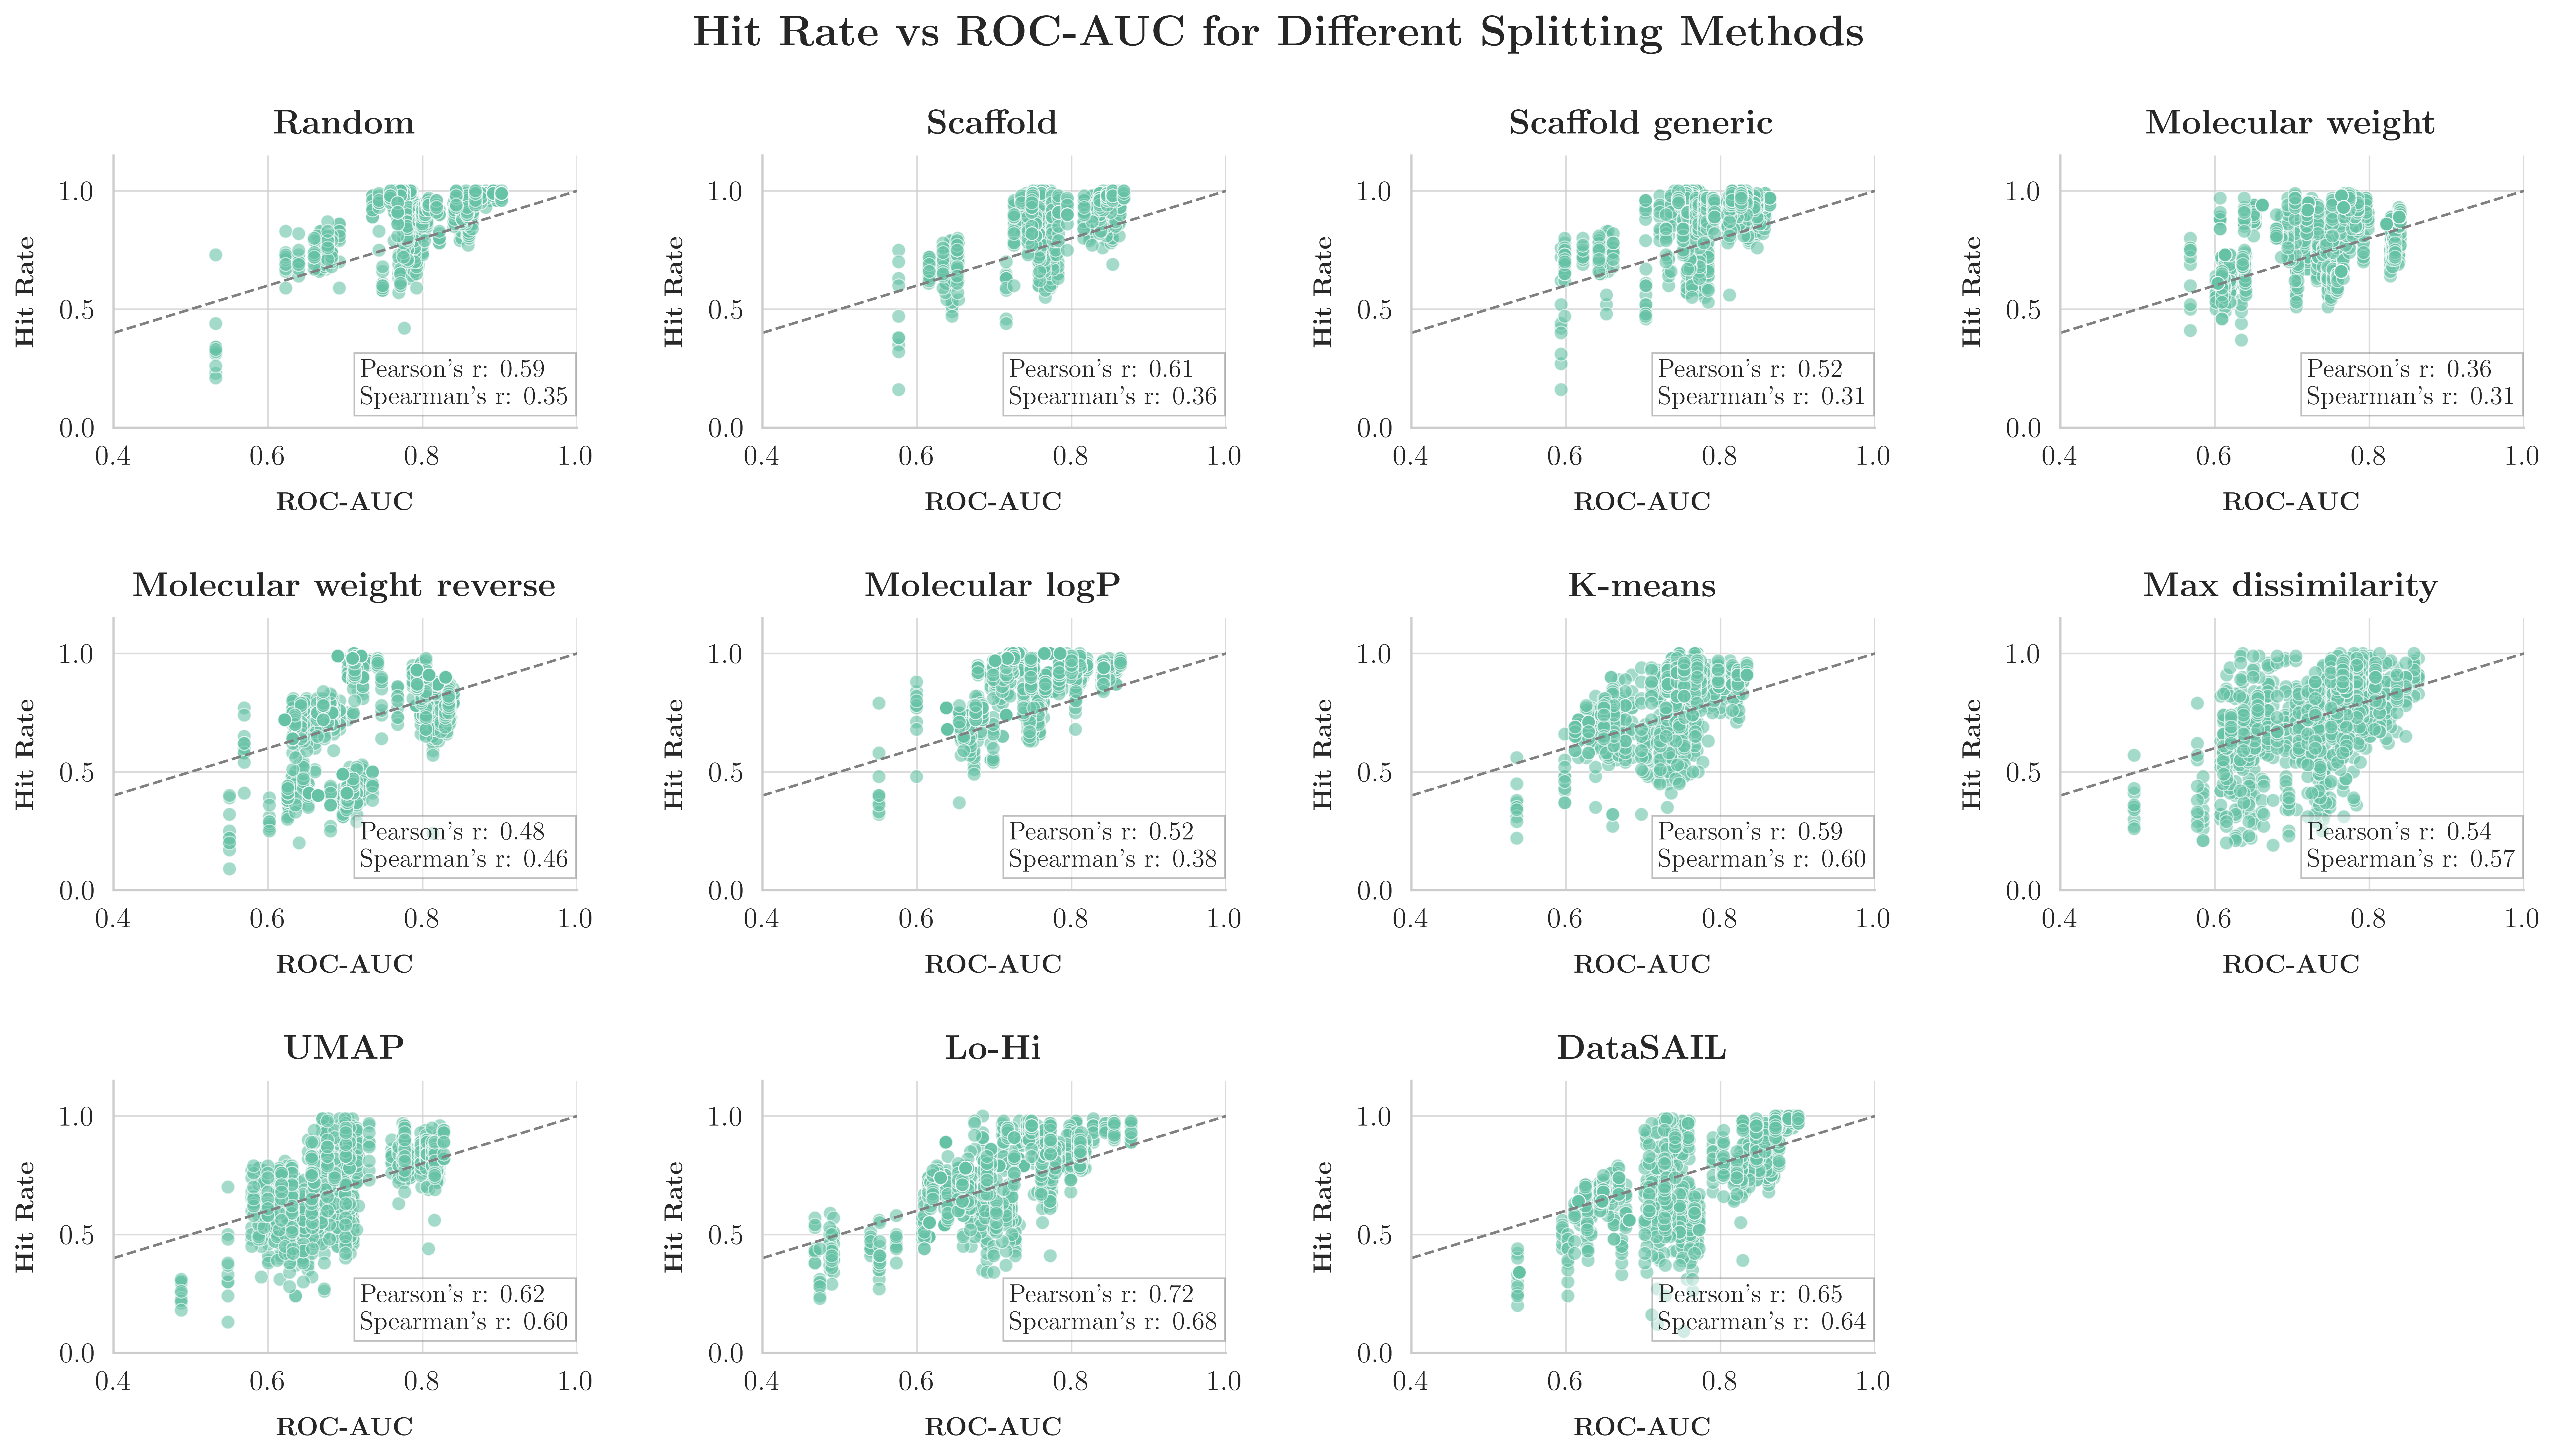
- Measure per-model ID and OOD accuracy/ROC-AUC, and pairwise agreement on both.
- Fit the ID↔OOD linear relationship (see
compute_linear_fitandcompare_rankings) and inspect how tightly points fall on the line across datasets, splitters, and model families.
Reproducing the analysis
The figures throughout this documentation are produced by the analysis notebooks
and scripts in the repository. Start from the
Visualization tutorial, and see
alinemol.utils for the plotting and metric helpers
(plot_ID_OOD, compute_linear_fit, eval_roc_auc, compare_rankings).
Reproducing the published results
The notebooks that generate every figure and table in the paper live in
notebooks/paper/.
Its
README
documents the full pipeline — datasets, splitting, training, inference —
that produces the notebooks' inputs, which are too large to ship in the
repository.
Citation
The full methodology and findings are described in the accompanying paper: